Patient Timeline
I designed a Patient Timeline feature to enhance an existing clinical trial viewer. This allowed site staff to visualize patient data over time, making it easier to track labs, medications, and procedures at a glance.
Due to NDA certain content is redacted and simplified.
MY ROLE
UI/UX DESIGNER
PRODUCT
B2B, SaaS
TIMELINE
JULY - DEC 2023


The Problem
Our application captured patient data through digital forms, but users couldn’t easily see how events unfolded over time. Without a timeline, tracking progress and identifying patterns was difficult. The goal was to design a visual view that made patient histories easier to follow while preserving the structure and integrity of the original data.

Key Requirements
Key requirements shaped this project's design approach
Data Consistency
Visualize data while preserving existing label structure (lab value units, medication groupings).
Category Coverage
Include a wide range of clinical categories such as labs, medications, clinical events, and procedures.
Design Limitation
I joined as the design team was forming and the system was still in its early stages, designing within emerging components to reduce dev lift.
Design Process
I reviewed our internal CRF form data and studied timelines used in other clinical trial platforms. I noticed frequent event overlap in short time spans. Lab results suited graph plotting, while procedures worked better with markers and tooltips. I had to keep these factors in mind, highlighting the need for clear hierarchy, grouping, and filtering
Low-fidelity draft
The Solution
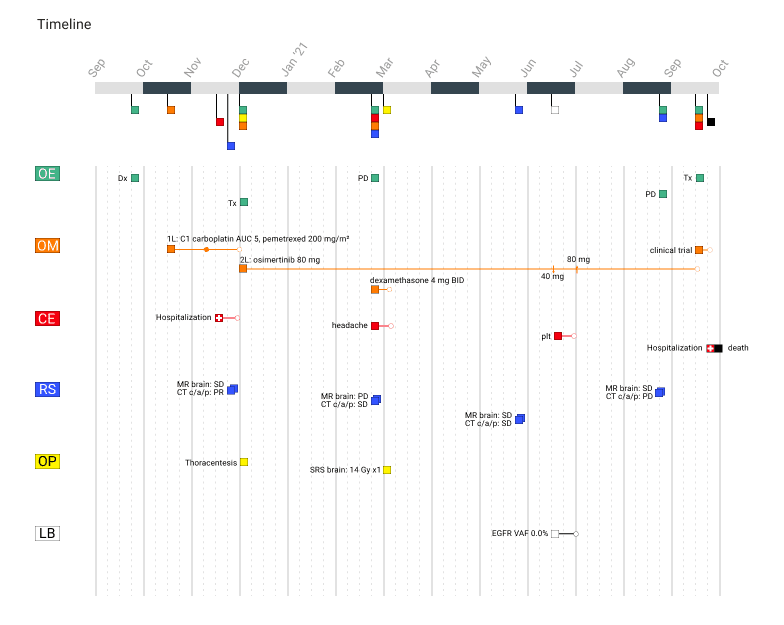
The final interface was designed as a color-coded, scrollable timeline. Key features included:
Color Grouping
Categories (labs, medications, procedures) were assigned a consistent color for easy reference.
Graph Support for Labs
Lab values were plotted on mini-line graphs with reference ranges shown for context.
Timeline Controls
A horizontal scrollbar and filter system allowed users to focus on specific time ranges, making it easier to navigate longer patient histories.

Detail Pop Up
Clicking an event opened a static popup to view additional CRF details.
Event Navigation
Repeatable events had directional arrows and step indicators for quicker review.

Reflection
This project strengthened my ability to work with complex and high density medical data without overwhelming the user. It required a strong balance between fidelity and the need for a clear, easy to read experience.
After this project was built out, it was easier for users to spot trends quickly, without scanning through endless rows of data. By combining filtering, grouping, and interactivity, I helped turn a static viewer into a comprehensive timeline.